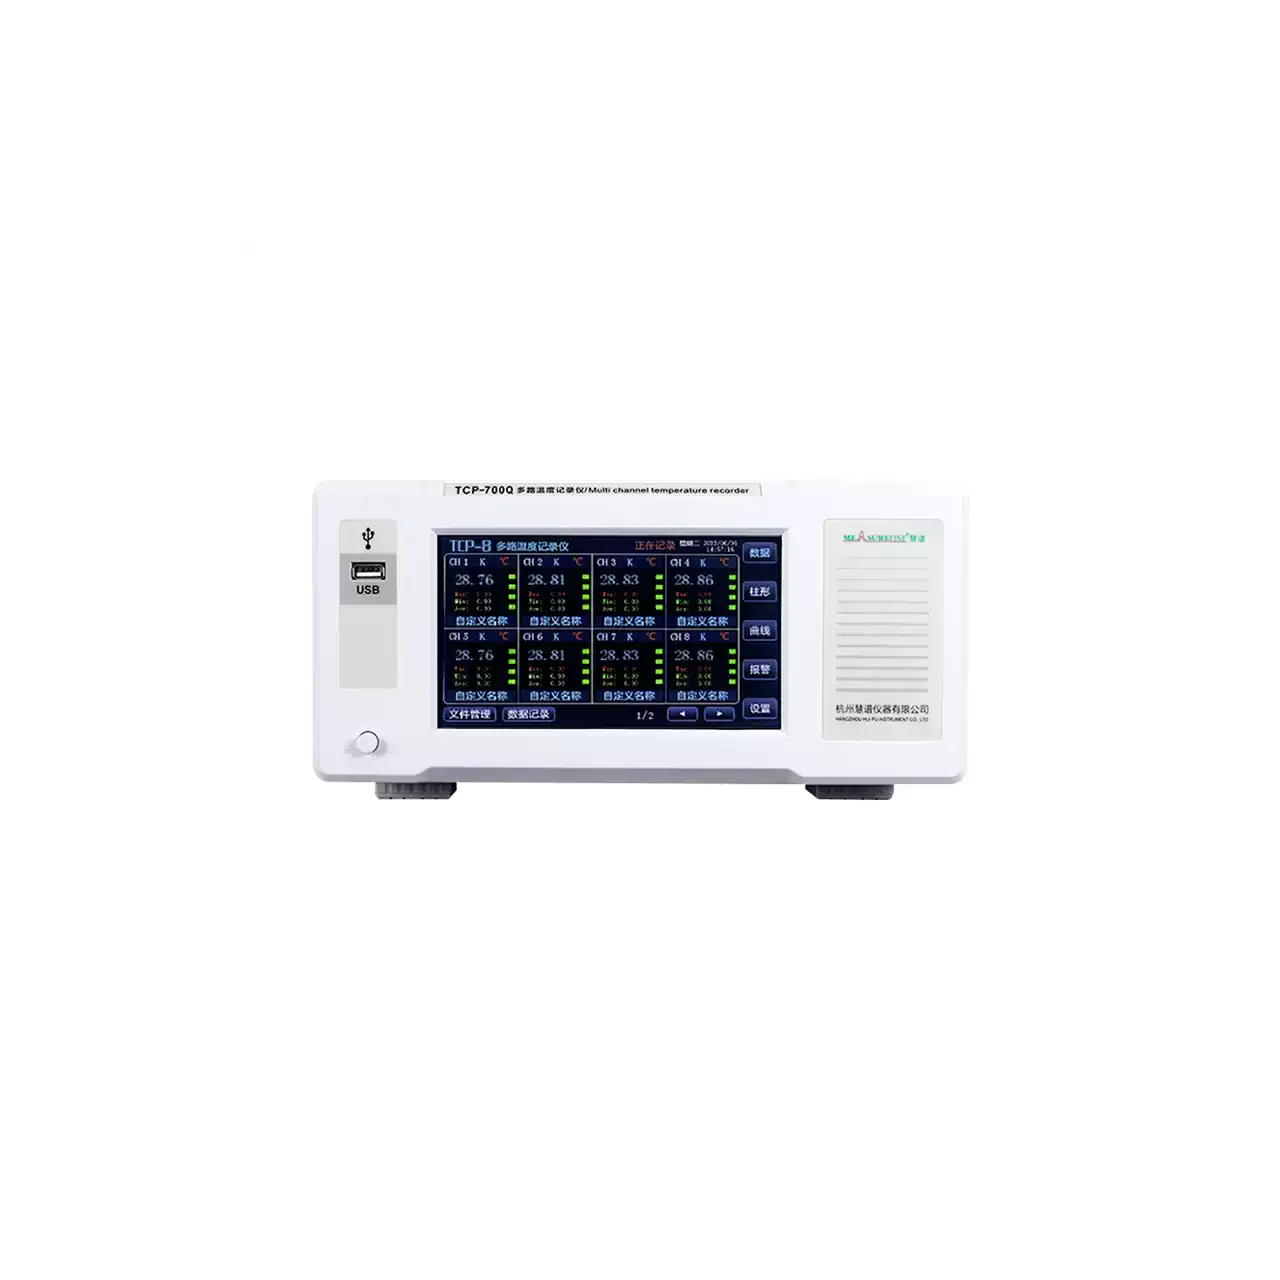
- Channels
- 8 to 64, by series
- Scan interval
- 0.1 to 9999 s, adjustable, with three preset speeds
- Accuracy
- ±0.2% ±2 digits, thermocouple excluded
- Range
- −200 to 1800 °C, sensor dependent
- Resolution
- 0.01 °C
- Display
- 7 in colour touchscreen, TFT-LCD
- Views
- Numeric list, live curve, bar graph, history curve, live alarm list
- Storage
- Internal memory, retained through a power loss
- Interfaces
- LAN, RS-232 and USB as standard; RS-485 and a wireless module to order
- Alarms
- Upper-upper, upper, lower and lower-lower per channel, with a buzzer
Paper chart recorders were replaced for two reasons: the pen ran out at the wrong moment, and the chart had to be walked to a desk before anyone could read it. This range answers both — the record is held in the instrument, and it can be opened from a phone.
Product overview
Three series share one touchscreen and one set of pages: numeric list, live curve, bar graph, history curve, live alarm list, and a system page for settings and export. They differ in how much voltage the terminals will take and in which sensors they accept.
The base series covers low-voltage bench work. The two live-circuit series raise the terminal rating and extend the channel count, and the full-function version adds resistance sensors and, to order, analogue and flow inputs. Channel counts are built in blocks of eight, and the rear terminals are grouped that way, so a large unit is wired as banks rather than one dense field.
The front carries the screen, a USB socket, a port for a power bank and the mains switch. Running from a power bank matters more than it sounds: it lets the instrument be carried to a machine that has no socket beside it, which is where a lot of temperature surveys actually happen.
How the paperless temperature recorder works
Each input is isolated from its neighbours before it reaches the scanner. That isolation is the reason a recorder can sit next to a contactor panel or a motor drive without the readings jumping: the switching transient is stopped at the input instead of being carried into the measuring circuit.
The scanner moves through the channels at the interval set on the panel. Short intervals give a dense record and fill the memory quickly; long intervals suit a soak test that runs for days. The three presets exist because most users want a defensible starting point rather than a number to reason about.
Each reading is linearised against the sensor type set for that channel, corrected with the per-channel trim, stamped with the system time and appended to the file. Because the file lives in internal memory, an interruption to the mains stops the test but does not erase it.
Alarms are compared at the same moment the sample is stored, so the alarm list and the curve agree about when a limit was crossed. The buzzer can be muted while the list keeps recording, which is what makes an overnight run tolerable in a occupied room.
How to select the right recorder
Begin with the voltage at the probes. If any channel is clipped to equipment that runs from the mains, the base series is out and the choice narrows to the two live-circuit series; the deciding figure is the potential at the terminal, not the supply of the instrument.
Then settle the sensor list. Thermocouples alone are covered by all three. A list that mixes thermocouples with PT100 or PT1000 needs the full-function series, and any channel fed by a current, voltage, flow or pressure signal needs it as well, ordered with those inputs.
Channel count comes third, and it should be rounded up. The instrument is built to a channel count, and the rear wiring is laid out in banks of eight, so moving from 16 to 24 later means a new unit rather than an extra card.
Finally decide how the data leaves. A USB drive is enough for a bench that files a report at the end of a shift; the network and wireless route is for a unit that has to be watched from elsewhere, or for a site where nobody is going to walk over with a stick every day. Send the channel list, the sensor types, the voltage at the probes and the length of the run, and a configuration can be put together against them.
Measurement limitations and selection considerations
The accuracy figure excludes the thermocouple. On a real installation the probe, its tolerance and its age dominate the error, which is why the supplied leads are worth specifying rather than treating as an accessory: a 2 m lead of the wrong alloy introduces an offset that no amount of instrument accuracy removes.
Isolation protects the measurement, not the operator. A channel rated for a live circuit still depends on the probe insulation, the condition of the lead and the way it is routed; an earthed sheath at one end can create a path through the recorder that has nothing to do with its input rating.
Scanning is sequential, so the channels do not share an instant. For a slow thermal process the difference is irrelevant; for a fault that crosses a machine in a few milliseconds it is not, and the order of events cannot be recovered from the record.
Memory is finite and shared across channels. A long run at a short interval and a high channel count will overwrite itself unless the data is moved, so the retention has to be calculated for the configuration rather than taken from the headline capacity. And the usable temperature span belongs to the sensor fitted, not to the instrument: the widest figure on the label applies only to the widest thermocouple.
Every value below is taken from source documentation. Where a parameter is not stated in the available material it is marked as information required rather than estimated.