- Channels
- 8 to 64, added in blocks of eight
- Thermocouple types
- K, S, R, B, N, E, J, T; W5/26 on the XL, 500 and 700 series
- Display accuracy
- 0.2% + 0.5 °C ±2 digits, thermocouple not included
- Temperature range
- −270 to 2310 °C as marked on most units; a second listing gives −200 to 1300 °C
- Live-circuit rating
- 500 V DC and 380 V AC
- Screen
- 4.3 in, 5 in or 7 in colour touchscreen, by series
- Views
- Numeric table, trend curve and bar graph
- Logging
- USB socket on every series, writing to a flash drive
- Alarms
- Upper-upper, upper, lower and lower-lower limits per channel; relay output to order
- Correction
- Per-channel linear correction, Y = Kx + b
A single thermocouple answers one question. A process that fails at one point out of twenty answers nothing until every point is on the same time base, which is why the channel count, not the accuracy figure, is usually what decides the purchase.
Product overview
Four series share one interface and differ in screen size, channel count and the range of sensors they accept. Channels are added in blocks of eight, so the range runs from a single block to eight blocks without a change of instrument family.
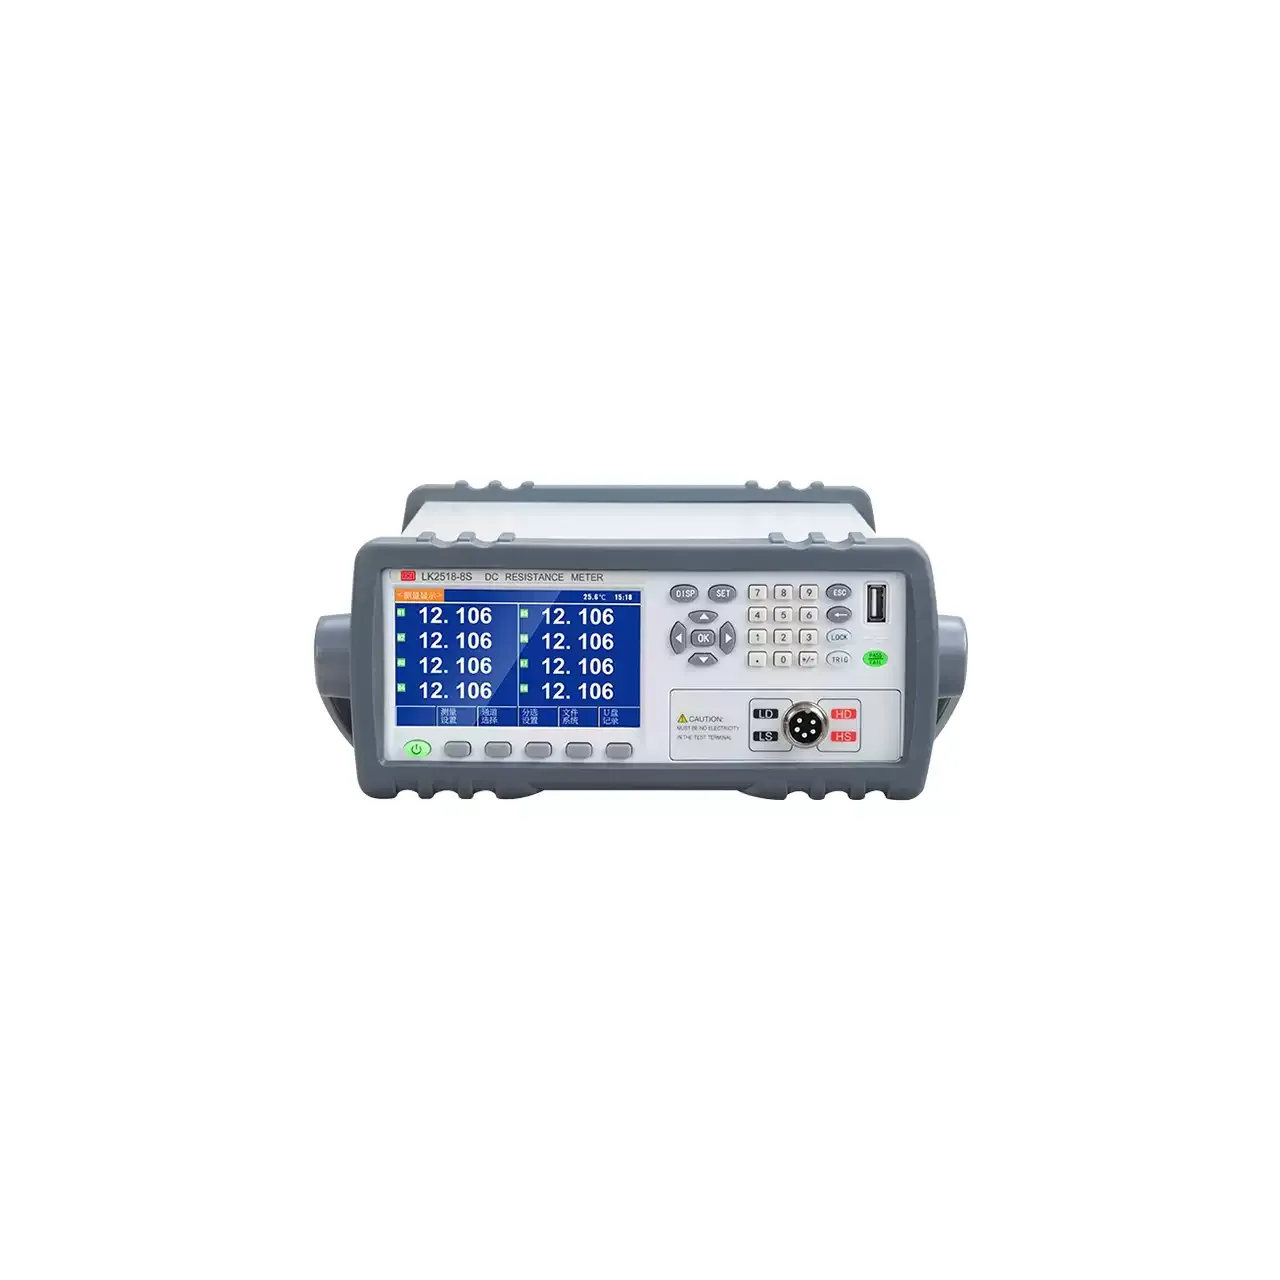
The front panel carries the screen, a USB socket, the power switch and a key that locks the touch layer — useful when a probe lead is being moved across the panel. The rear carries the thermocouple terminals, a communication port, the fuse holder and the mains inlet.
Views are chosen rather than configured. A numeric table shows every channel at once with its tag, sensor type, unit and running maximum, minimum and average; a trend view plots the same channels against time with a movable cursor; a bar view turns each channel into a column against a span. The last two are what separate a slow drift from a single spike, and they read the same logged record.
How the multi-channel temperature recorder works
There is one measuring circuit, not one per channel. A multiplexer switches each thermocouple input into it in turn, so the channels are scanned rather than sampled together. The scan rate is therefore shared: the more channels fitted, the longer the interval between successive readings of the same point.
Each input produces a small voltage that depends on the difference between the hot junction and the terminals where the lead lands. A cold-junction sensor at the terminals supplies the second temperature, and the firmware adds it before converting the result. The conversion itself follows the thermocouple type set for that channel, because K, S, R and the rest have different curves and cannot share one table.
The per-channel correction is applied after linearisation. It is a straight line, so it removes a fixed offset and a proportional error — a probe reading consistently low, or a lead whose extension wire is not the same alloy as the thermocouple. It does not remove a curve that bends, and it does not correct a probe that has drifted unevenly across its span.
Logged data is written to the instrument first and copied to a USB drive on demand. Curves are held in a fixed memory, which is why the retention time falls as channels are added: the same memory holds more points per second at 64 channels than at eight.
How to select the right recorder
Start with the point count and the growth expected over the life of the bench, then round up to whole blocks of eight. The channel count is fixed at build, so the only cheap moment to add capacity is before the order.
Then list the sensors. Thermocouples alone are covered by every series. A mixed list with PT100, PT1000 or Cu50 needs a P variant, and a channel fed by a flow, pressure, current or voltage signal needs the Q variant. Those variants are not field upgrades.
Screen size follows how the instrument will be read. Where an operator stands at the panel and works from curves, the largest screen earns its space; where the unit sits in a rack and the data leaves over USB, the smaller body is the better fit.
The last two questions are electrical. Whether any channel sits on a live circuit decides whether the input rating matters at all, and whether the readings leave on a drive or over the rear port decides how the test is documented. Send the point list, the sensor types and the voltage present at the probes and a configuration can be proposed against them.
Measurement limitations and selection considerations
The accuracy figure describes the instrument, and the thermocouple is excluded from it. On a real job the probe and its tolerance usually dominate the error, so a tighter recorder does not by itself give a tighter measurement; matched probes and a calibration check at the working temperature do more.
Because the channels are scanned, two points are never read at the same instant. For slow processes the offset is irrelevant. For a fault that travels through a machine in milliseconds, the order of events across channels is not recoverable from the record, and a simultaneous sampler is a different instrument.
The live-circuit rating is a limit on the input, not a statement about operator isolation. Wiring, probe insulation and the way the leads are routed still decide whether the measurement is safe, and a probe whose sheath is earthed at one end can create a loop through the recorder.
Curve retention is finite and falls with channel count, so a run that lasts a shift at high channel count needs the data moved to a drive or a PC before it is overwritten. Finally, the usable temperature span is set by the thermocouple type fitted, not by the widest figure on the label; a type T probe and a type B probe on the same recorder do not share a range.
Every value below is taken from source documentation. Where a parameter is not stated in the available material it is marked as information required rather than estimated.