- Frequency range
- 20 Hz to 200 kHz, 500 kHz, 1 MHz, 2 MHz or 5 MHz, by model
- Basic accuracy
- 0.05% on the 200 kHz and 500 kHz models; 0.1% on the 1 MHz, 2 MHz and 5 MHz models
- Frequency resolution
- 1 mHz
- Impedance range
- 0.01 mΩ to 99.99 MΩ
- Phase resolution
- 0.01°
- Scan parameters
- R-X, Z-phase, Y-phase and G-B
- Scan time
- 4 s for a 400-point sweep
- Comparator
- Three levels: pass, above upper limit, below lower limit
- Storage
- 50 setups internal and 500 on a USB drive
- Body
- 310 × 110 × 315 mm at 5.5 kg, or 400 × 132 × 300 mm at 8.5 kg
A piezoelectric device is specified by where it resonates, not by a value at one frequency. That single fact decides what an analyzer has to do: sweep a band, plot the result, and let the resonance and anti-resonance be read from the curve. Everything else on the instrument supports that job.
Product overview
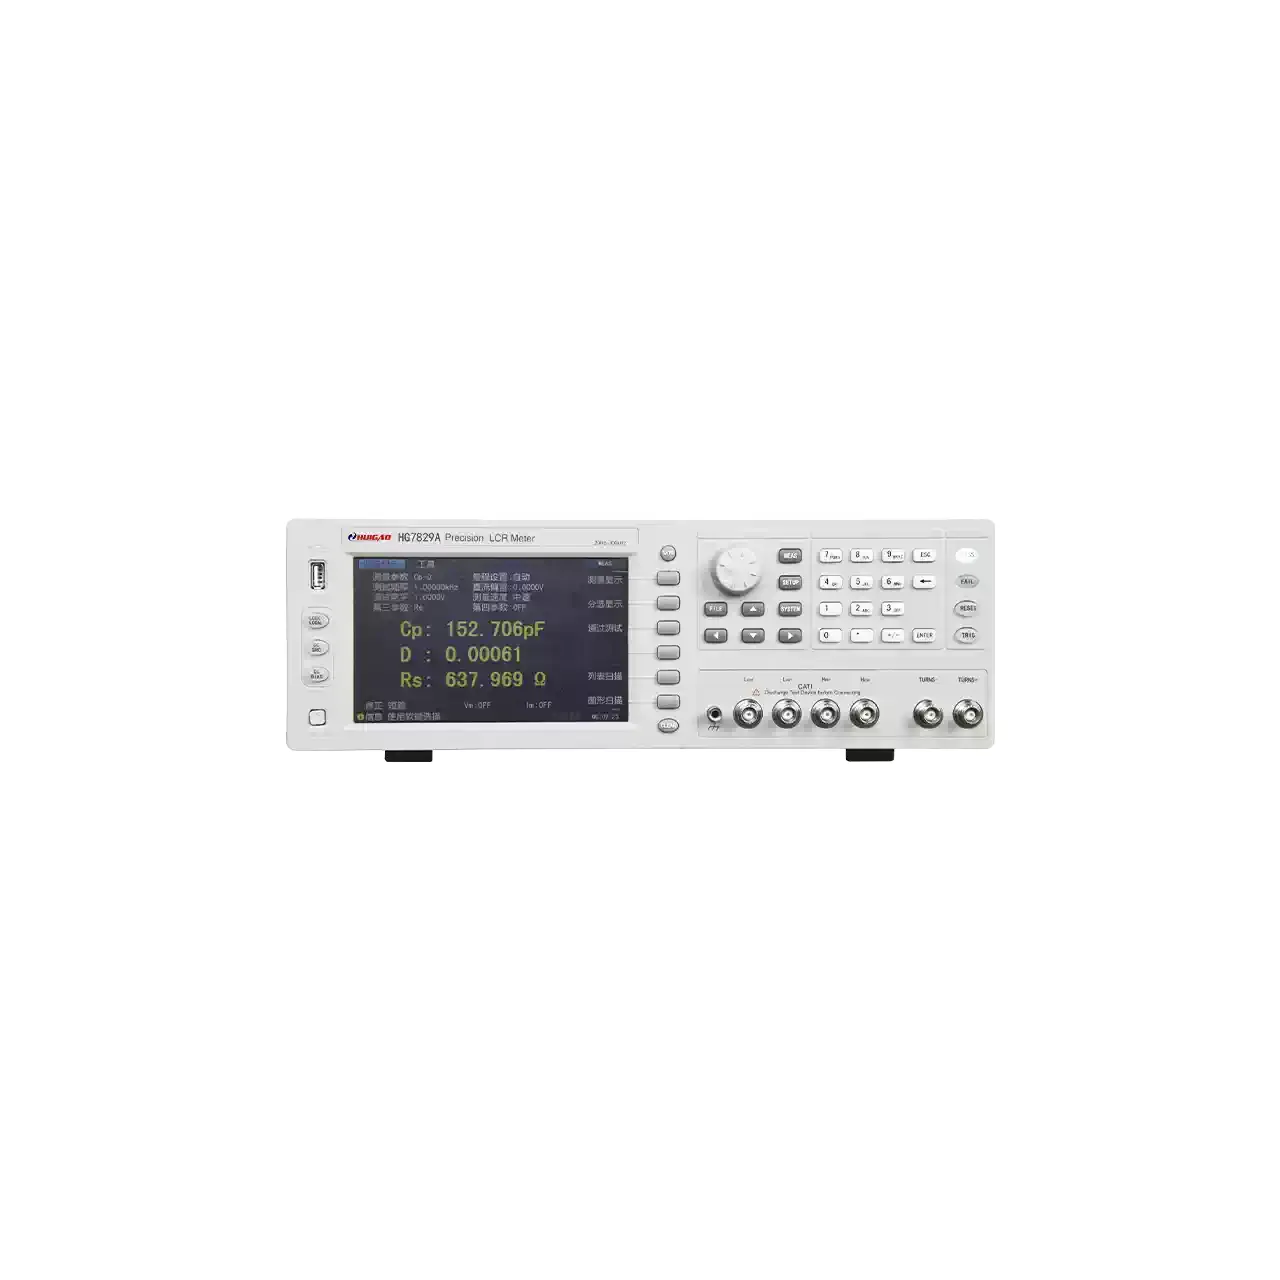
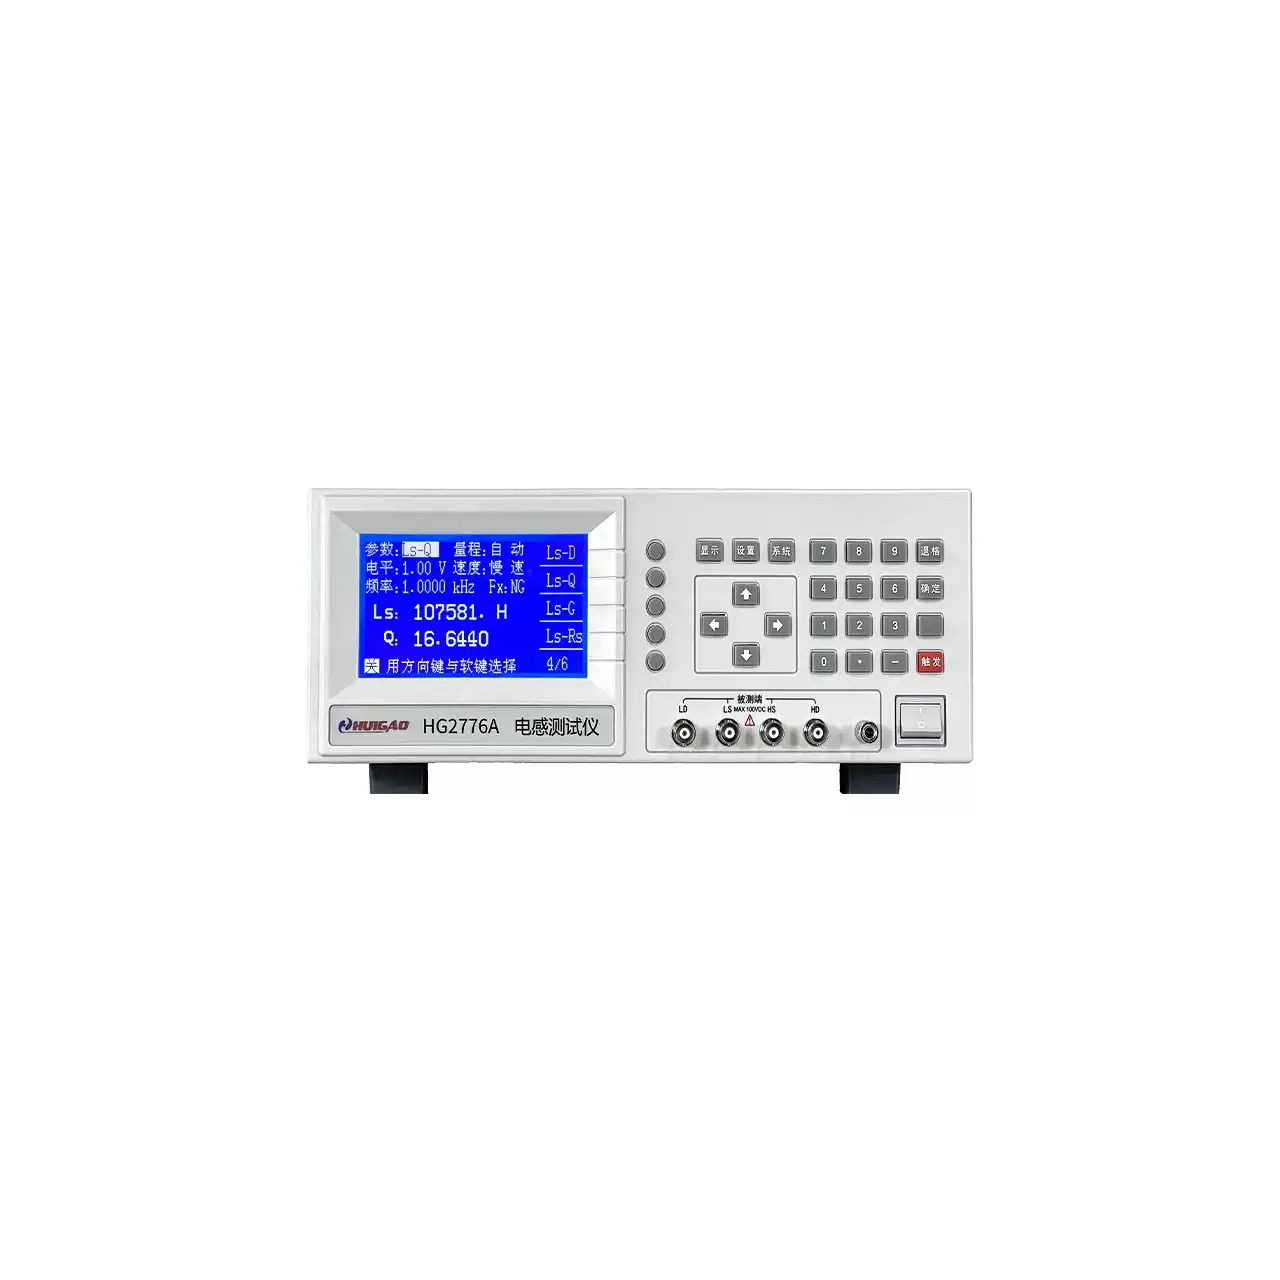
The family covers 20 Hz to 5 MHz across five models, in two body sizes. The two lower-frequency models reach 0.05% basic accuracy; the three higher ones are quoted at 0.1%. All of them use the same four-wire Kelvin terminals, the same 4.3-inch colour display and the same sweep functions.
The front panel carries the display at the left with a column of soft keys beside it, the keypad and controls at the right, and the four test terminals along the lower edge. The lower-frequency models are 310 mm wide at 5.5 kg; the 2 MHz and 5 MHz models move to a 400 mm body at 8.5 kg. The rear panel carries the handler, serial and USB connectors.
How the impedance analyzer works
The instrument applies a drive current through the device and senses the voltage across it on a separate pair of leads. At each frequency in the sweep it resolves the two signals into an in-phase and a quadrature component, from which impedance and phase follow directly. Because the current and voltage electrodes are separate, the resistance of the leads and of the contact does not enter the result — which is what makes a reading of a few ohms credible.
The sweep steps the frequency across a band and stores the result at each point, then plots impedance against frequency. For a piezoelectric part, the plot shows a minimum at resonance and a maximum at anti-resonance; the frequencies of those two points and the impedance at each are what the device drawing usually specifies.
The scan parameters select how the same data is presented: as resistance and reactance, as impedance and phase, as admittance and phase, or as conductance and susceptance. A 400-point sweep takes about 4 s, so a device can be checked in the time it takes to load the next one.
How to select the right impedance analyzer
The first question is the frequency band. A device that resonates below 200 kHz is covered by the smallest model; one that resonates at 1 MHz needs the 1 MHz model; a transducer that operates at 2 or 5 MHz needs the larger body. Buying above the band the device actually uses adds cost and nothing else.
The second is accuracy. The 0.05% models cover the lower bands, and the 0.1% models cover the higher ones — a difference that matters when a limit is tight, but not when the device tolerance is a few percent, which is common for piezoelectric ceramics.
The third is contact. A disc, a stack and a Langevin transducer need three different fixtures, and the fixture has to hold the part at a repeatable pressure as well as a repeatable position. The clamp force changes the resonance of a piezo stack, so the fixture is part of the measurement, not an accessory.
The fourth is what happens to the result. The three-level comparator and the lamps suit a bench where an operator loads parts; the handler and serial ports suit a line that sorts automatically; the stored setups suit a bench that changes product several times a shift.
Measurement limitations and selection considerations
The instrument measures small-signal impedance. It does not drive the device at its working power, so the large-signal behaviour of a transducer — the shift of resonance with drive level, the heating, the displacement — is outside what a sweep at a few volts can show.
The fixture dominates at the top of the frequency range. At 5 MHz a few centimetres of lead is a significant impedance and its position changes the reading, so a proper test fixture with a defined geometry is not optional. The same applies to the contact pressure on a stack: a different clamp force gives a different resonance.
The basic accuracy figure is a headline, not a guarantee across the band. Accuracy varies with impedance and frequency, and the material refers to a separate accuracy table that it does not include. Where a measurement is used as a limit, the accuracy at that specific impedance and frequency has to be established rather than inferred from the basic figure.
Finally, a sweep describes a device at one moment and one temperature. Piezoelectric ceramics shift with temperature, and a part measured cold will not match the same part measured after it has been running. Comparing a curve against a reference curve taken under the same conditions is more useful than comparing single numbers.
Every value below is taken from source documentation. Where a parameter is not stated in the available material it is marked as information required rather than estimated.